Pi Cycle Top: A Signal That Bitcoin May Be Peaking
Last updated
Written by

Reviewed by

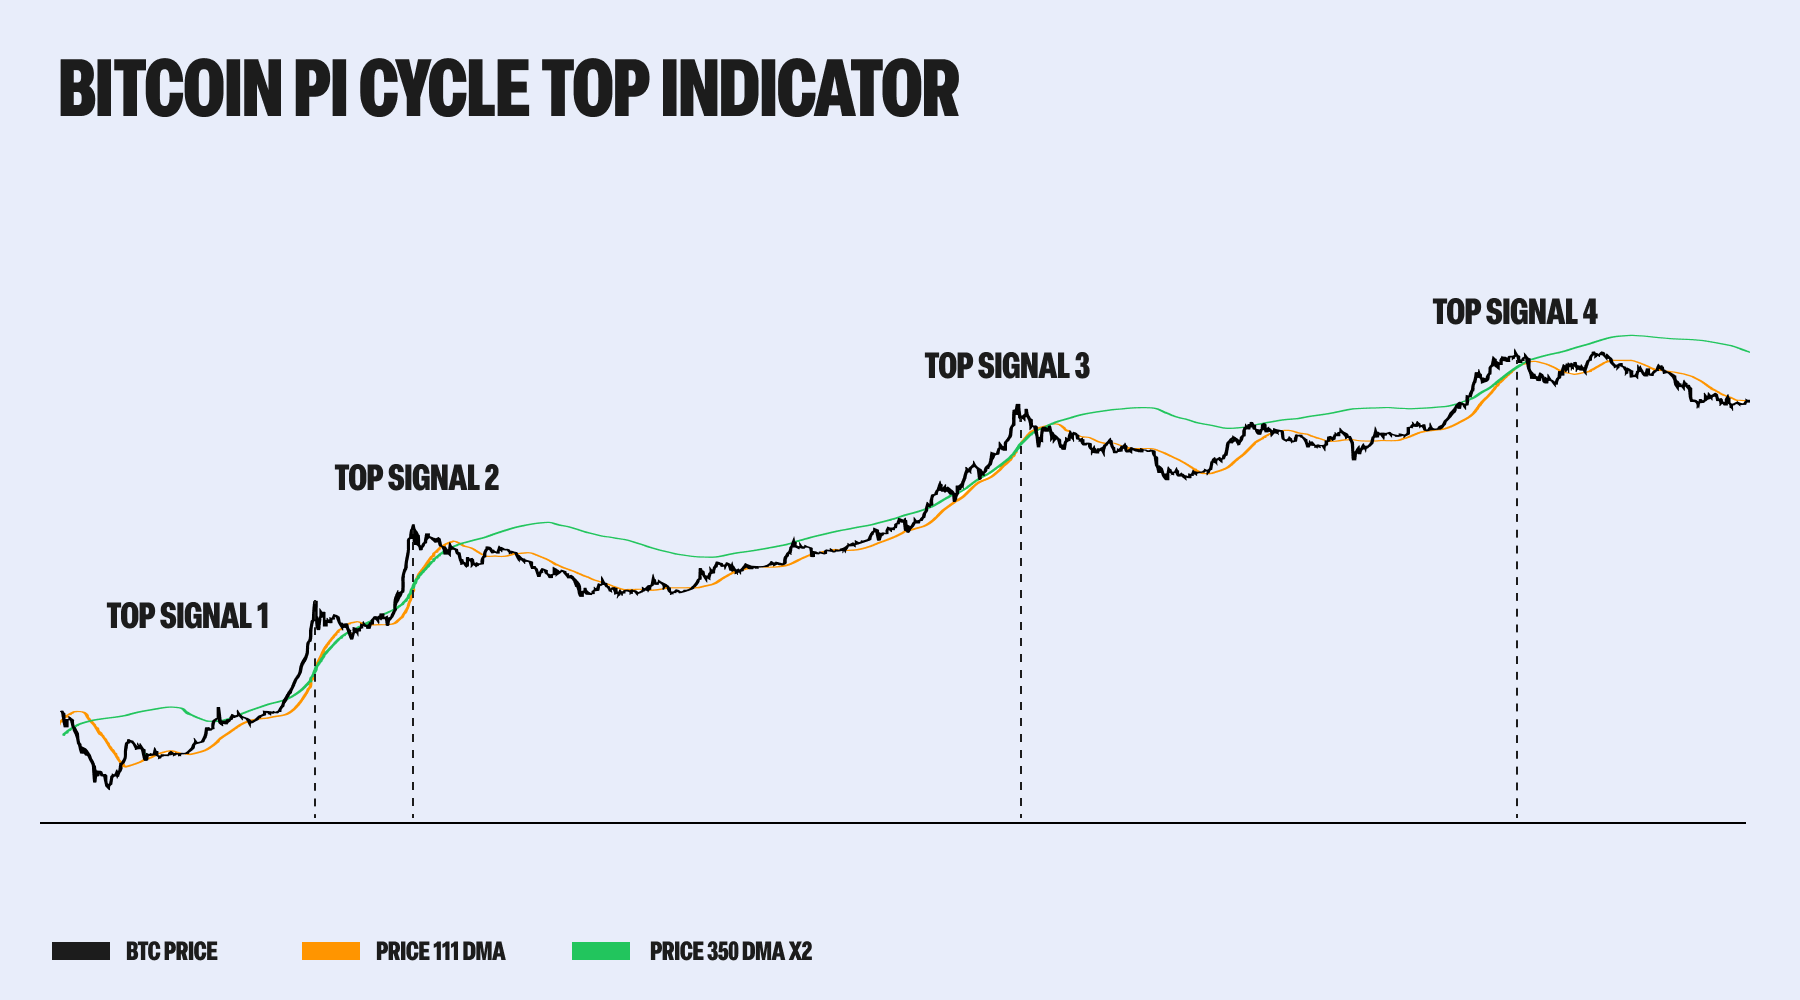
Table of Contents
Disclaimer: This article is for educational purposes only and does not constitute financial advice. Always do your own research before making investment decisions.
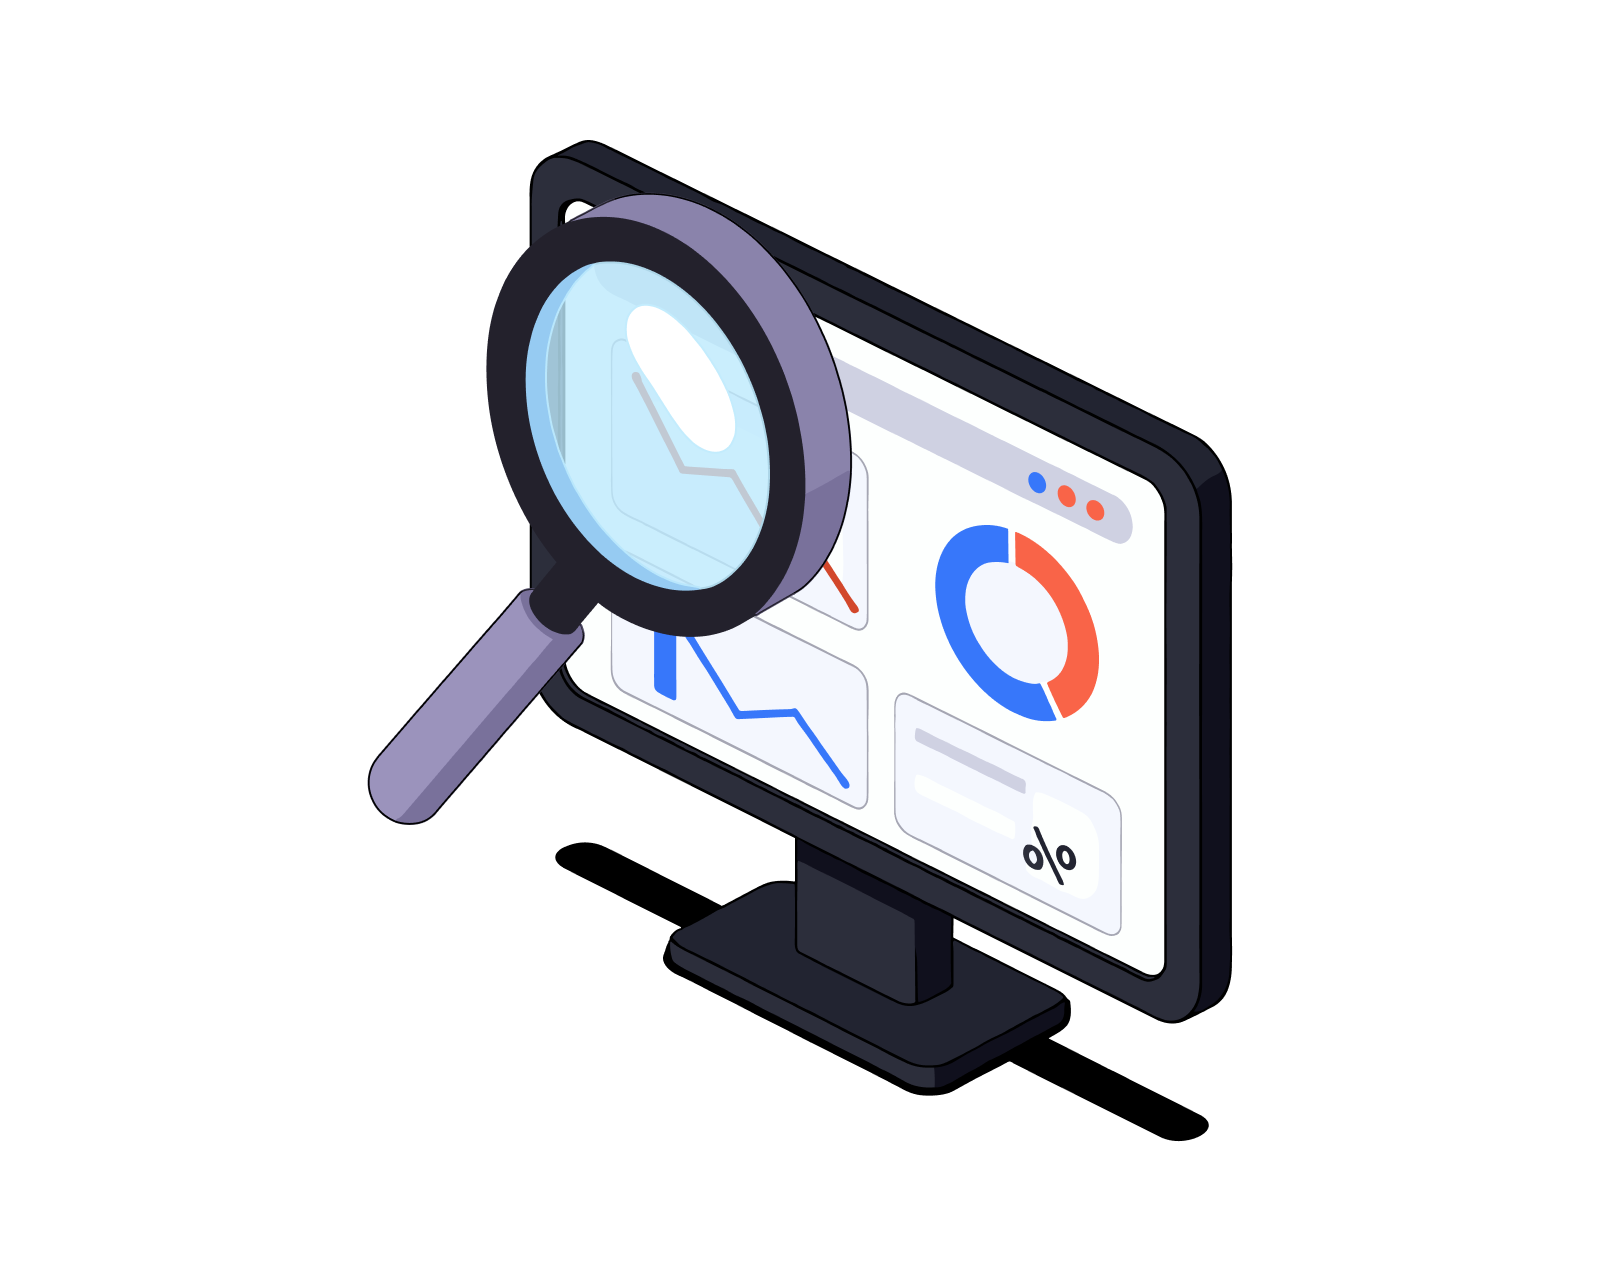
Overview of the Pi Cycle Top Indicator
The Pi Cycle Top is not a traditional candlestick pattern. It’s a moving average crossover indicator designed specifically for Bitcoin. It gained popularity after correctly signaling the top of the 2013, 2017, and 2021 Bitcoin bull markets - all within three days of the actual price peak.
It works by comparing a short-term moving average (111-day) with a long-term moving average (350-day), multiplied by two. When the faster 111-day MA crosses above the 2 × 350-day MA, it generates a potential market top signal.
The crossover suggests that Bitcoin’s short-term price has accelerated far beyond its long-term trend - a condition that has historically marked the end of a major uptrend.
What Does It Look Like?
The Pi Cycle Top indicator is a visual crossover between two smoothed price lines:
- A blue line representing the 111-day simple moving average (111DMA)
- An orange line representing 2 × the 350-day simple moving average (2 × 350DMA)
When the blue line crosses above the orange line, it triggers a Pi Cycle Top signal.
This crossover often occurs near the highest price point of the cycle - making it a useful tool for long-term investors looking to take profits near the top.
Signal Criteria
The Pi Cycle Top follows this logic:
- Calculate the 111-day simple moving average (111DMA) of Bitcoin’s daily closing prices.
- Calculate the 350-day simple moving average (350DMA) of Bitcoin’s daily closing prices, then multiply that by 2.
- When 111DMA > (2 × 350DMA) and the crossover occurs from below, a Pi Cycle Top signal is generated.
This structure has correctly signaled three major Bitcoin tops:
- December 2013
- December 2017
- April 2021
Each crossover occurred just 1-3 days before the actual price peak.
How to Interpret the Pi Cycle Top
This indicator is often interpreted as a macro top signal. It doesn’t predict short-term pullbacks or local highs - it aims to identify when Bitcoin is approaching the peak of a full market cycle.
Here’s what it means in practice:
- A warning sign: Bitcoin’s short-term price is rising faster than its long-term average - often unsustainably so.
- A profit-taking opportunity: Historically, this has been a high-probability zone to reduce exposure or lock in gains.
- A reversal setup: These crossovers have preceded large drawdowns and multi-month bear markets.
While no indicator is perfect, the Pi Cycle Top’s historical precision makes it one of the more respected tools among on-chain analysts.
Example in Action
Let’s look at how the Pi Cycle Top played out in April 2021:
- Signal Date: April 12, 2021
- BTC Price: ~$63,000
- Actual Top: ~$64,800 on April 14
- Result: Bitcoin fell more than 50% over the next two months
If a trader had sold on the crossover day, they would have nearly timed the top - avoiding one of the sharpest corrections of that cycle.
Conclusion
The Pi Cycle Top is a simple moving average crossover that has provided powerful signals at some of Bitcoin’s most important turning points. While it doesn’t predict tops in advance, it helps identify when the market is extremely overheated.
Because of its reliability in past cycles, many long-term Bitcoin investors now keep an eye on this signal as part of their broader strategy.
Next Steps
- Learn about the Golden Cross, a bullish moving average signal that often precedes major rallies.
- Understand the Bearish Cross, the opposite signal to the Golden Cross.
- Explore other reversal patterns like the Shooting Star and Evening Star.
- Use free charting tools to apply the 111DMA and 2 × 350DMA to Bitcoin charts and monitor the crossover yourself.
By combining the Pi Cycle Top with other technical and on-chain indicators - and keeping long-term macro trends in mind - traders can make more confident, cycle-aware decisions.
Explore Related Articles:
- A Beginner’s Guide to Candlestick Charts
- Rising Bullish Hammer Candlestick Pattern Explained
- Shooting Star (Falling Hammer) Candlestick Pattern Explained
- Bullish Engulfing: A Signal That Buyers Are Taking Over
- Bearish Engulfing: A Signal That Sellers Are Taking Control
- Morning Star Pattern: A Signal That Buyers Are Stepping In
- Evening Star: A Signal That Sellers Are Stepping In
- Golden Cross: A Signal That Bullish Momentum Is Building
- Bearish (Death) Cross: A Signal That Momentum May Be Turning Against the Market
- What Is the MACD Indicator? A Guide to Moving Average Convergence Divergence in Crypto
- Relative Strength Index (RSI): Spotting Overbought and Oversold Markets
- Stochastic Oscillator: Measuring Momentum and Spotting Reversals
Get started by understanding the basics of cryptocurrency and explore decentralized finance (DeFi). Learn about Bitcoin, Ethereum, and altcoins. Also, discover how to buy and sell crypto.
Disclaimer
No Investment Advice
The information provided in this article is for educational purposes only and does not constitute investment advice, financial advice, trading advice, or any other type of advice. Bitcoin.com does not recommend or endorse the buying, selling, or holding of any cryptocurrency, token, or financial instrument. You should not rely on the content of this article as a basis for any investment decision. Always do your own research and consult a licensed financial advisor before making any investment decisions.
Accuracy of Information
While we strive to ensure the accuracy and reliability of the information presented, Bitcoin.com makes no guarantees regarding the completeness, timeliness, or accuracy of any content. All information is provided “as is” and is subject to change without notice. You understand that you use any information available here at your own risk.
Related guides
Start from here →
What is a Decentralized Exchange (DEX)?
A decentralized exchange (DEX) is a type of exchange that specializes in peer-to-peer transactions of cryptocurrencies and digital assets. Unlike centralized exchanges (CEXs), DEXs do not require a trusted third party, or intermediary, to facilitate the exchange of cryptoassets.

What is a Centralized Exchange (CEX)?
Learn about CEXs, the differences between them and DEXs, and whether they’re safe to use.
What is a Centralized Exchange (CEX)?
Learn about CEXs, the differences between them and DEXs, and whether they’re safe to use.

How does crypto exchange work?
How safe is it to store your crypto on centralized exchanges?
How does crypto exchange work?
How safe is it to store your crypto on centralized exchanges?
Bitcoin Trading for Beginners
A comprehensive guide to Bitcoin trading for beginners, covering wallets, exchanges, market analysis, and risk management strategies.
Bitcoin Trading for Beginners
A comprehensive guide to Bitcoin trading for beginners, covering wallets, exchanges, market analysis, and risk management strategies.

Reading Bitcoin Charts for Beginners
A beginner's guide to understanding Bitcoin charts, covering candlestick patterns, technical indicators, market analysis, and risk management.
Reading Bitcoin Charts for Beginners
A beginner's guide to understanding Bitcoin charts, covering candlestick patterns, technical indicators, market analysis, and risk management.
Bull vs Bear Market Explained
Learn what defines bull and bear markets, how investor behavior shifts in each phase, and how Bitcoin historically moves through market cycles.
Bull vs Bear Market Explained
Learn what defines bull and bear markets, how investor behavior shifts in each phase, and how Bitcoin historically moves through market cycles.
Trading Analysis: Fundamental, Technical & Sentimental
Learn about fundamental, technical, and sentimental analysis for smarter trading decisions. Explore examples, tools, and how to combine these methods for a holistic market view.
Trading Analysis: Fundamental, Technical & Sentimental
Learn about fundamental, technical, and sentimental analysis for smarter trading decisions. Explore examples, tools, and how to combine these methods for a holistic market view.

STAY AHEAD IN CRYPTO
Stay ahead in crypto with our weekly newsletter delivering the insights that matter most

Weekly crypto news, curated for you

Actionable insights and educational tips

Updates on products fueling economic freedom
No spam. Unsubscribe anytime.
Start investing safely with the Bitcoin.com Wallet
Over wallets created so far
Everything you need to buy, sell, trade, and invest your Bitcoin and cryptocurrency securely
Download App


© 2026 Saint Bitts LLC Bitcoin.com. All rights reserved
Download App
Company
Insights
Products & Services
Reviews
Follow
© 2026 Saint Bitts LLC Bitcoin.com. All rights reserved