What Is the MACD Indicator? A Guide to Moving Average Convergence Divergence in Crypto
Last updated
Written by

Reviewed by

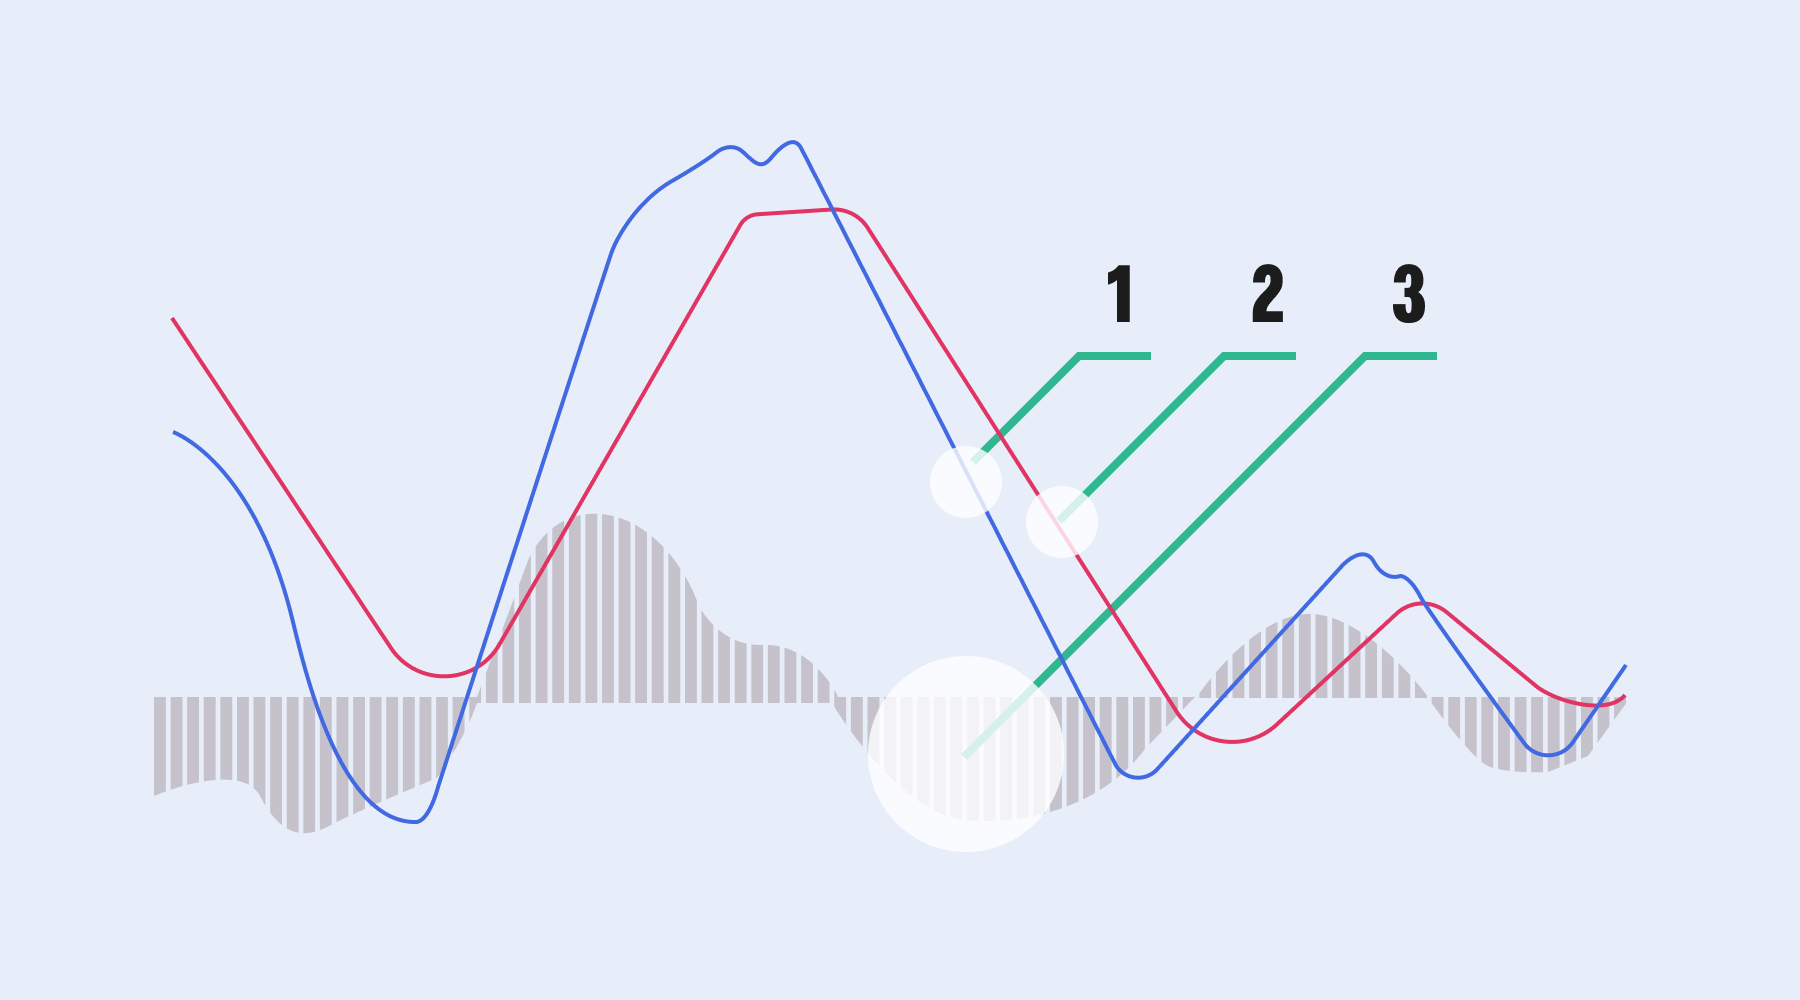
Table of Contents
Disclaimer: This article is for educational purposes only and does not constitute financial advice. Always do your own research before making investment decisions.
Overview of the MACD
The Moving Average Convergence Divergence (MACD) was developed by Gerald Appel in the late 1970s. It’s a trend-following momentum indicator that compares short-term and long-term price movements using exponential moving averages (EMAs).
By tracking the relationship between these moving averages, the MACD shows when momentum is strengthening, weakening, or reversing.
Unlike leading indicators that attempt to predict future moves, the MACD is a lagging indicator - it reacts to price changes that have already occurred. This makes it especially useful for confirming trends or identifying divergences between price and momentum.
What Does It Look Like?
The MACD consists of three key components plotted on a chart below the asset’s price:
- MACD Line - The difference between a short-term EMA (commonly 12 periods) and a longer-term EMA (commonly 26 periods).
- Signal Line - A 9-period EMA of the MACD line, used to generate buy or sell triggers.
- Histogram - A bar chart showing the distance between the MACD line and the signal line.
All three components fluctuate above and below a zero line, which acts as the midpoint between bullish and bearish momentum.
Signal Criteria and Formula
The MACD is calculated in three steps:
Step 1 - MACD Line
MACD Line = EMA(12) - EMA(26)
Step 2 - Signal Line
Signal Line = EMA(9) of the MACD Line
Step 3 - Histogram
Histogram = MACD Line - Signal Line
Most charting platforms use the standard MACD (12, 26, 9) settings by default. However, traders can adjust these periods to make the indicator more or less sensitive to price changes.
How to Interpret the MACD
-
Signal Line Crossovers
- Bullish crossover - MACD line moves above the signal line, suggesting upward momentum and a potential buy signal.
- Bearish crossover - MACD line moves below the signal line, suggesting downward momentum and a potential sell signal.
-
Zero Line Crossovers
- Above zero - The short-term EMA is higher than the long-term EMA, indicating bullish momentum.
- Below zero - The short-term EMA is lower than the long-term EMA, indicating bearish momentum.
-
Divergences
- Bullish divergence - Price makes lower lows while the MACD makes higher lows. This can signal that selling pressure is weakening and a reversal may follow.
- Bearish divergence - Price makes higher highs while the MACD makes lower highs. This can signal that buying pressure is weakening and a downward reversal may follow.
Example in Action
Imagine Bitcoin is trading in a steady uptrend. The MACD line crosses above the signal line and both are above the zero line. At the same time, the histogram turns positive, showing growing momentum.
A trader might see this as confirmation to stay in a long position or enter a new one. Conversely, if the MACD line drops below the signal line while still above zero, it could indicate weakening momentum - a cue to tighten stops or take profits.
Limitations of the MACD
While the MACD is powerful, it’s not foolproof:
- It can produce false signals in sideways or choppy markets.
- Divergences don’t always lead to reversals.
- Relying on the MACD alone increases the risk of mistimed entries or exits.
For this reason, many traders combine the MACD with other tools like the Relative Strength Index (RSI), trendlines, or support/resistance levels.
Conclusion
The MACD is a versatile indicator that helps traders track trend direction and momentum shifts. By learning to read its crossovers, zero line movements, and divergences, traders can better time entries and exits.
It’s best used as part of a broader trading strategy that includes confirmation signals and risk management.
Next Steps
- Learn about the Relative Strength Index (RSI), another momentum indicator that pairs well with MACD.
- Explore candlestick reversal patterns like the Morning Star or Bullish Engulfing to combine with MACD crossovers.
- Practice identifying MACD signals on live crypto charts with free charting tools to sharpen your timing.
By integrating the MACD indicator into a broader trading strategy that includes confirmation signals and risk management, traders can improve their ability to time entries and exits and make more confident decisions.
Explore Related Articles:
- A Beginner’s Guide to Candlestick Charts
- Rising Bullish Hammer Candlestick Pattern Explained
- Shooting Star (Falling Hammer) Candlestick Pattern Explained
- Bullish Engulfing: A Signal That Buyers Are Taking Over
- Bearish Engulfing: A Signal That Sellers Are Taking Control
- Morning Star Pattern: A Signal That Buyers Are Stepping In
- Evening Star: A Signal That Sellers Are Stepping In
- Golden Cross: A Signal That Bullish Momentum Is Building
- Bearish (Death) Cross: A Signal That Momentum May Be Turning Against the Market
- Pi Cycle Top: A Signal That Bitcoin May Be Peaking
- Relative Strength Index (RSI): Spotting Overbought and Oversold Markets
- Stochastic Oscillator: Measuring Momentum and Spotting Reversals
Get started by understanding the basics of cryptocurrency and explore decentralized finance (DeFi). Learn about Bitcoin, Ethereum, and altcoins. Also, discover how to buy and sell crypto.
Disclaimer
No Investment Advice
The information provided in this article is for educational purposes only and does not constitute investment advice, financial advice, trading advice, or any other type of advice. Bitcoin.com does not recommend or endorse the buying, selling, or holding of any cryptocurrency, token, or financial instrument. You should not rely on the content of this article as a basis for any investment decision. Always do your own research and consult a licensed financial advisor before making any investment decisions.
Accuracy of Information
While we strive to ensure the accuracy and reliability of the information presented, Bitcoin.com makes no guarantees regarding the completeness, timeliness, or accuracy of any content. All information is provided “as is” and is subject to change without notice. You understand that you use any information available here at your own risk.
Related guides
Start from here →
What is a Decentralized Exchange (DEX)?
A decentralized exchange (DEX) is a type of exchange that specializes in peer-to-peer transactions of cryptocurrencies and digital assets. Unlike centralized exchanges (CEXs), DEXs do not require a trusted third party, or intermediary, to facilitate the exchange of cryptoassets.

What is a Centralized Exchange (CEX)?
Learn about CEXs, the differences between them and DEXs, and whether they’re safe to use.
What is a Centralized Exchange (CEX)?
Learn about CEXs, the differences between them and DEXs, and whether they’re safe to use.

How does crypto exchange work?
How safe is it to store your crypto on centralized exchanges?
How does crypto exchange work?
How safe is it to store your crypto on centralized exchanges?
Bitcoin Trading for Beginners
A comprehensive guide to Bitcoin trading for beginners, covering wallets, exchanges, market analysis, and risk management strategies.
Bitcoin Trading for Beginners
A comprehensive guide to Bitcoin trading for beginners, covering wallets, exchanges, market analysis, and risk management strategies.

Reading Bitcoin Charts for Beginners
A beginner's guide to understanding Bitcoin charts, covering candlestick patterns, technical indicators, market analysis, and risk management.
Reading Bitcoin Charts for Beginners
A beginner's guide to understanding Bitcoin charts, covering candlestick patterns, technical indicators, market analysis, and risk management.

Bull vs Bear Market Explained
Learn what defines bull and bear markets, how investor behavior shifts in each phase, and how Bitcoin historically moves through market cycles.
Bull vs Bear Market Explained
Learn what defines bull and bear markets, how investor behavior shifts in each phase, and how Bitcoin historically moves through market cycles.
Trading Analysis: Fundamental, Technical & Sentimental
Learn about fundamental, technical, and sentimental analysis for smarter trading decisions. Explore examples, tools, and how to combine these methods for a holistic market view.
Trading Analysis: Fundamental, Technical & Sentimental
Learn about fundamental, technical, and sentimental analysis for smarter trading decisions. Explore examples, tools, and how to combine these methods for a holistic market view.

STAY AHEAD IN CRYPTO
Stay ahead in crypto with our weekly newsletter delivering the insights that matter most

Weekly crypto news, curated for you

Actionable insights and educational tips

Updates on products fueling economic freedom
No spam. Unsubscribe anytime.

Start investing safely with the Bitcoin.com Wallet
Over wallets created so far
Everything you need to buy, sell, trade, and invest your Bitcoin and cryptocurrency securely
Download App


© 2026 Saint Bitts LLC Bitcoin.com. All rights reserved
Download App
Company
Insights
Products & Services
Reviews
Follow
© 2026 Saint Bitts LLC Bitcoin.com. All rights reserved