Bearish (Death) Cross: A Signal That Momentum May Be Turning Against the Market
Last updated
Written by

Reviewed by

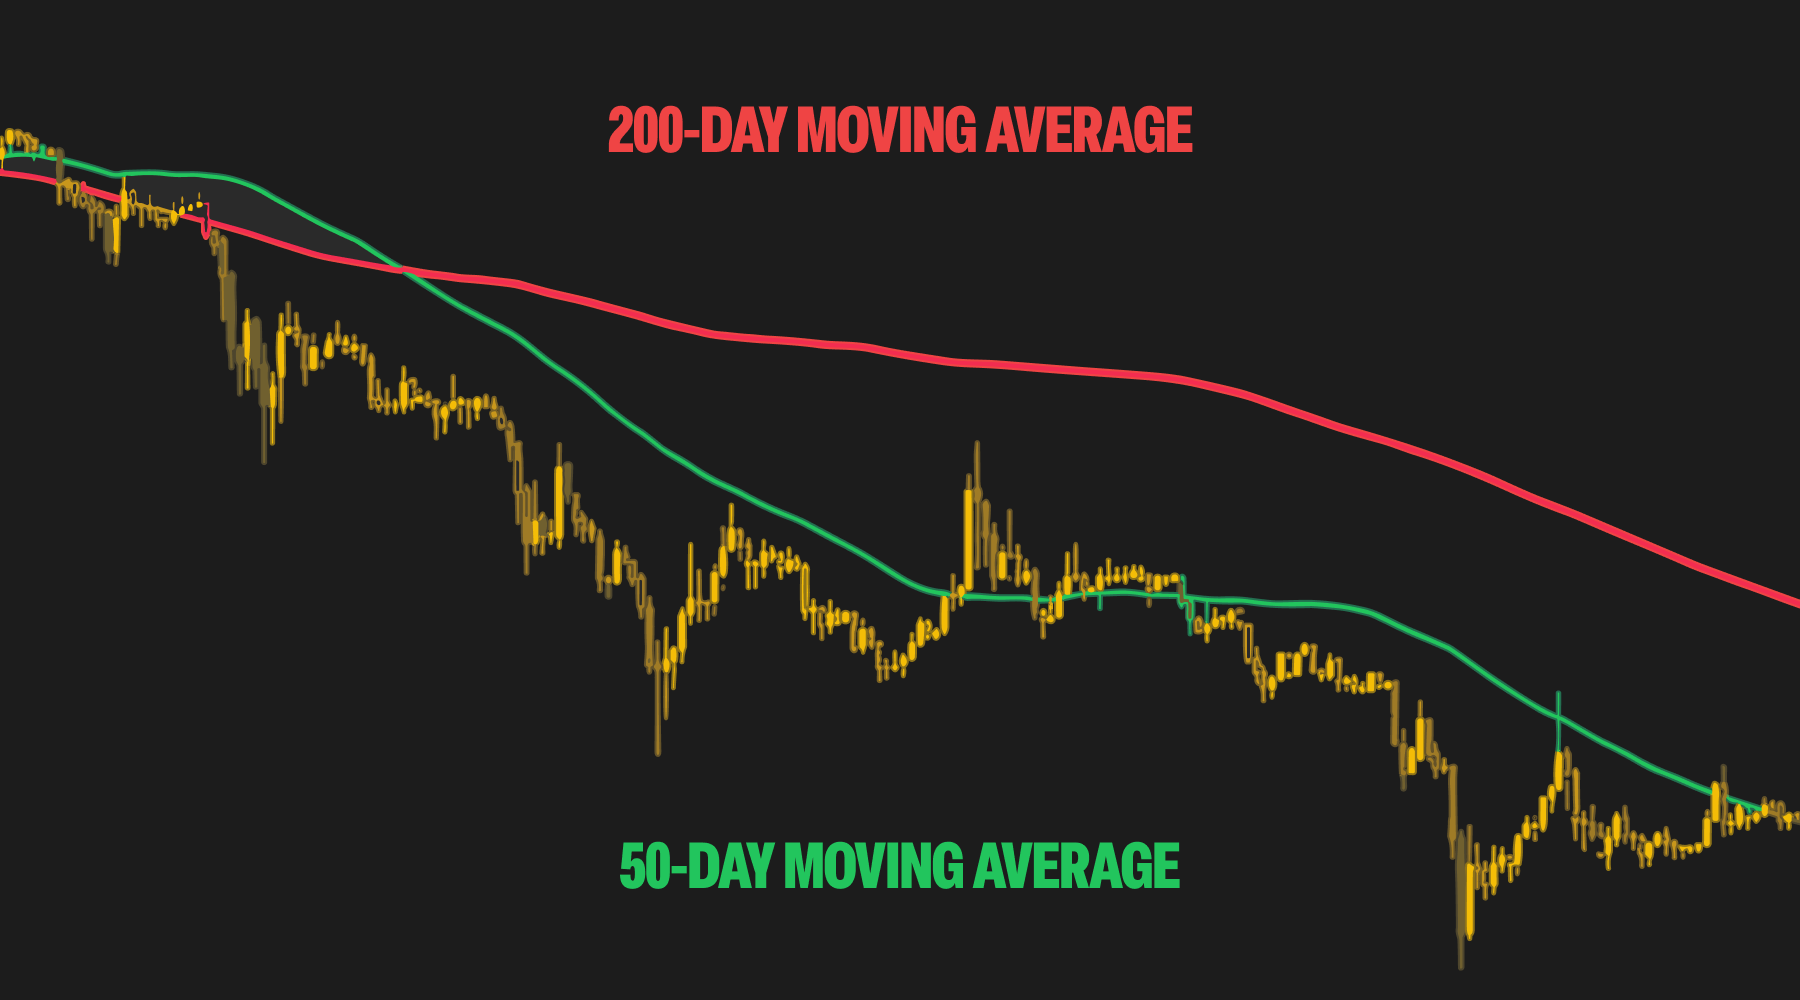
Table of Contents
Disclaimer: #This article is for educational purposes only and does not constitute financial advice. Always do your own research before making investment decisions.#
Overview of the Bearish Cross
The bearish cross - also known as the Death Cross - appears on a chart when the 50-day moving average (MA) crosses below the 200-day moving average. This suggests that short-term price momentum is weakening compared to the longer-term trend, and it often signals a shift from a bullish market to a bearish one.
This signal has historically preceded major downtrends - not only in crypto but also in traditional markets. However, it’s important to remember that moving average crossovers are lagging indicators, meaning they reflect momentum that has already shifted, rather than predicting a move in advance.
For crypto traders, the bearish cross is often used as a warning sign: a cue to reduce exposure, tighten stop losses, or seek confirmation from other technical indicators before making a move.
What Does It Look Like?
The bearish cross plays out in three typical stages:
- Uptrend phase - The 50-day MA is trending above the 200-day MA as price moves higher.
- Crossover phase - Momentum weakens and the 50-day MA crosses below the 200-day MA.
- Downtrend phase - The 50-day MA continues to diverge lower, and the price may begin to trend downward.
On a chart, it looks like two lines intersecting - with the faster-moving 50-day line cutting down through the slower-moving 200-day line. Traders often monitor volume spikes, RSI, or MACD to validate whether the crossover is significant.
Signal Criteria
The bearish cross is typically defined by the following:
- The market is coming off an extended uptrend or consolidation period.
- The 50-day moving average crosses below the 200-day moving average.
- The 50-day MA continues to slope downward, and the price often begins to follow.
- The signal gains strength when accompanied by high volume, or when confirmed by momentum indicators like RSI or MACD.
While the daily chart is the most common time frame for identifying this signal, some traders look for crossovers on weekly charts for longer-term trend confirmation.
How to Interpret the Bearish Cross
The bearish cross is widely viewed as a long-term bearish signal. It suggests that short-term selling pressure is overtaking the longer-term trend and may indicate that the market has shifted from accumulation to distribution.
However, it’s important to treat this pattern as confirmation, not prediction. By the time the bearish cross appears, prices may have already begun to decline. Traders who rely solely on this signal may be entering too late or reacting to an already exhausted move.
That’s why many traders look for additional confirmation using:
- Volume trends - Is the cross happening with a surge in sell volume?
- RSI - Is the asset overbought or entering oversold territory?
- MACD - Is momentum diverging or confirming the trend shift?
In some cases, the death cross turns out to be a false signal, especially during sideways or choppy markets. The 50-day MA may dip below the 200-day MA briefly, only to reverse shortly after - a scenario known as a whipsaw.
Example in Action
Imagine Bitcoin has been rallying for several months. But recently, momentum has slowed, and price has begun to consolidate or dip. Over time, the 50-day moving average begins to flatten and eventually crosses below the 200-day moving average.
This crossover forms the bearish cross, signaling that short-term weakness is now dominating. Traders watching this may:
- Exit long positions
- Enter short trades
- Or wait for further confirmation from RSI, MACD, or support breakdowns
If volume spikes during the crossover and price breaks below recent support levels, the bearish cross becomes even more significant.
Conclusion
The Bearish Cross, or death cross, is a long-term technical signal that suggests weakening momentum and a potential shift into a bearish trend. While it can mark the beginning of major downturns, it’s also prone to false signals - especially in sideways markets.
Because it’s a lagging indicator, traders should use it as part of a broader toolkit that includes momentum indicators, trendlines, and fundamental analysis.
Next Steps
- Learn about the Golden Cross, the bullish mirror image of the bearish cross.
- Explore technical tools like RSI, MACD, and volume analysis to strengthen your trading strategy.
- Practice identifying crossover patterns on live charts using free tools and paper trading platforms (simulated environments that let you test strategies without risking real funds).
By understanding and applying the bearish cross within the right context, crypto traders can better prepare for long-term trend changes and manage risk more effectively.
Explore Related Articles:
- A Beginner’s Guide to Candlestick Charts
- Rising Bullish Hammer Candlestick Pattern Explained
- Shooting Star (Falling Hammer) Candlestick Pattern Explained
- Bullish Engulfing: A Signal That Buyers Are Taking Over
- Bearish Engulfing: A Signal That Sellers Are Taking Control
- Morning Star Pattern: A Signal That Buyers Are Stepping In
- Evening Star: A Signal That Sellers Are Stepping In
- Golden Cross: A Signal That Bullish Momentum Is Building
- Pi Cycle Top: A Signal That Bitcoin May Be Peaking
- What Is the MACD Indicator? A Guide to Moving Average Convergence Divergence in Crypto
- Relative Strength Index (RSI): Spotting Overbought and Oversold Markets
- Stochastic Oscillator: Measuring Momentum and Spotting Reversals
Get started by understanding the basics of cryptocurrency and explore decentralized finance (DeFi). Learn about Bitcoin, Ethereum, and altcoins. Also, discover how to buy and sell crypto.
Disclaimer
No Investment Advice
The information provided in this article is for educational purposes only and does not constitute investment advice, financial advice, trading advice, or any other type of advice. Bitcoin.com does not recommend or endorse the buying, selling, or holding of any cryptocurrency, token, or financial instrument. You should not rely on the content of this article as a basis for any investment decision. Always do your own research and consult a licensed financial advisor before making any investment decisions.
Accuracy of Information
While we strive to ensure the accuracy and reliability of the information presented, Bitcoin.com makes no guarantees regarding the completeness, timeliness, or accuracy of any content. All information is provided “as is” and is subject to change without notice. You understand that you use any information available here at your own risk.
Related guides
Start from here →
What is a Decentralized Exchange (DEX)?
A decentralized exchange (DEX) is a type of exchange that specializes in peer-to-peer transactions of cryptocurrencies and digital assets. Unlike centralized exchanges (CEXs), DEXs do not require a trusted third party, or intermediary, to facilitate the exchange of cryptoassets.

What is a Centralized Exchange (CEX)?
Learn about CEXs, the differences between them and DEXs, and whether they’re safe to use.
What is a Centralized Exchange (CEX)?
Learn about CEXs, the differences between them and DEXs, and whether they’re safe to use.

How does crypto exchange work?
How safe is it to store your crypto on centralized exchanges?
How does crypto exchange work?
How safe is it to store your crypto on centralized exchanges?
Bitcoin Trading for Beginners
A comprehensive guide to Bitcoin trading for beginners, covering wallets, exchanges, market analysis, and risk management strategies.
Bitcoin Trading for Beginners
A comprehensive guide to Bitcoin trading for beginners, covering wallets, exchanges, market analysis, and risk management strategies.

Reading Bitcoin Charts for Beginners
A beginner's guide to understanding Bitcoin charts, covering candlestick patterns, technical indicators, market analysis, and risk management.
Reading Bitcoin Charts for Beginners
A beginner's guide to understanding Bitcoin charts, covering candlestick patterns, technical indicators, market analysis, and risk management.

Bull vs Bear Market Explained
Learn what defines bull and bear markets, how investor behavior shifts in each phase, and how Bitcoin historically moves through market cycles.
Bull vs Bear Market Explained
Learn what defines bull and bear markets, how investor behavior shifts in each phase, and how Bitcoin historically moves through market cycles.
Trading Analysis: Fundamental, Technical & Sentimental
Learn about fundamental, technical, and sentimental analysis for smarter trading decisions. Explore examples, tools, and how to combine these methods for a holistic market view.
Trading Analysis: Fundamental, Technical & Sentimental
Learn about fundamental, technical, and sentimental analysis for smarter trading decisions. Explore examples, tools, and how to combine these methods for a holistic market view.

STAY AHEAD IN CRYPTO
Stay ahead in crypto with our weekly newsletter delivering the insights that matter most

Weekly crypto news, curated for you

Actionable insights and educational tips

Updates on products fueling economic freedom
No spam. Unsubscribe anytime.
Start investing safely with the Bitcoin.com Wallet
Over wallets created so far
Everything you need to buy, sell, trade, and invest your Bitcoin and cryptocurrency securely
Download App


© 2026 Saint Bitts LLC Bitcoin.com. All rights reserved
Download App
Company
Insights
Products & Services
Reviews
Follow
© 2026 Saint Bitts LLC Bitcoin.com. All rights reserved