Як читати графіки біткоїна для початківців
Останнє оновлення
Написано автором

Переглянуто

Зміст
- Декодування графіків Біткоїна: Посібник для початківців
- Типи графіків Біткоїна
- Розуміння свічкових патернів і обсягу торгів
- Технічні індикатори та аналіз графіків
- Аналіз графіків: Визначення ключових рівнів
- Часові рамки, ліквідність та фундаментальний аналіз
- Управління ризиками та психологія торгівлі
- Графіки Біткоїна та ширша екосистема
- Висновок: Практика та безперервне навчання
Декодування графіків Біткоїна: Посібник для початківців
Графіки Біткоїна є важливими інструментами для аналізу ринкових трендів, руху цін та торгових можливостей. Розуміння того, як читати ці графіки, може допомогти трейдерам ухвалювати обґрунтовані рішення та розробляти стратегічний підхід до торгівлі Біткоїном.
Цей посібник охоплює основи читання графіків Біткоїна, включаючи ключові концепції, індикатори та практичні поради для підвищення ваших навичок торгівлі.
Почніть з швидкого введення в Біткоїн. Заглибтесь у що таке Біткоїн і досліджуйте його історію походження-від ідеї до глобальної фінансової революції. Також досліджуйте торгівлю Біткоїном для початківців.
Типи графіків Біткоїна
Різні типи графіків надають різні перспективи на історію цін Біткоїна, допомагаючи трейдерам ефективно аналізувати тренди та рухи ринку.
-
Лінійні графіки: Відображають тільки ціни закриття з часом, пропонуючи простий огляд цінових трендів. Ідеально підходять для початківців і довгострокового аналізу трендів.
-
Барові графіки: Показують ціну відкриття, закриття, найвищу та найнижчу ціну за кожен період, надаючи більше деталей, ніж лінійні графіки, і допомагаючи трейдерам аналізувати волатильність ринку.
-
Свічкові графіки (найпоширеніші): Улюблений тип графіка серед трейдерів, візуально представляє рух цін за допомогою кольорових свічок. Зелені (або білі) свічки вказують на висхідний рух (закриття > відкриття). Червоні (або чорні) свічки вказують на низхідний рух (закриття < відкриття).
Розуміння цих типів графіків дозволяє трейдерам ефективніше ідентифікувати тренди, цінові патерни та потенційні торгові можливості.
Розуміння свічкових патернів і обсягу торгів
Свічкові патерни надають уявлення про можливі цінові розвороти або продовження тренду, допомагаючи трейдерам ухвалюва�ти обґрунтовані рішення. Деякі загальні патерни включають:
- Доджі: Свічка з маленьким тілом, що вказує на невизначеність ринку, часто передує розвороту тренду.
- Молоток / Повішений чоловік: Маленьке тіло з довгим нижнім гнітом, що сигналізує про можливий ціновий розворот (молоток у висхідному тренді, повішений чоловік у низхідному тренді).
- Патерн поглинання: Велика свічка повністю поглинає попередню, що вказує на сильний розворот тренду (бичачий або ведмежий).
Обсяг торгів: Підтвердження цінової дії
Обсяг торгів, кількість Біткоїнів, що торгуються за певний період, допомагає підтвердити цінові тренди:
- Високий обсяг при зростанні ціни сигналізує про сильний бичачий імпульс.
- Високий обсяг при падінні ціни вказує на сильний ведмежий тиск.
Дізнайтеся більше про обсяг торгів та як він впливає на рух цін Біткоїна, включаючи його роль у визначенні бичачих трендів та ведмежого тиску на ринку.
Технічні індикатори та аналіз графіків
Технічні індикатори аналізують дані про ціни та обсяг для генерування торгових сигналів, допомагаючи трейдерам ідентифікувати тренди та ринкові умови. Популярні індикатори включають:
- Скользящі середні (MA): Згладжують дані про ціни, щоб визначити тренди та потенційні рівні підтримки/опору.
- Індекс відносної сили (RSI): Вимірює імпульс і визначає перекуплені чи перепродані умови.
- MACD (схождение-расхождение скользящих средних): Виявляє зміни трендів та зміни імпульсу, допомагаючи трейдерам виявити точки входу та виходу.
- Смуги Боллінджера: Відображають волатильність цін і допомагають ідентифікувати потенційні прориви або розвороти.
Дізнайтеся більше про технічні індикатори та як вони впливають на торгові стратегії.
Аналіз графіків: Визначення ключових рівнів
Аналіз графіків допомагає трейдерам розпізнати тренди, рівні підтримки та опору, які є критичними для прогнозування рухів цін:
- Тренди: Визначення висхідних, низхідних або бічних рухів цін.
- Рівні підтримки: Області, де очікується, що тиск покупців переважить тиск продавців, потенційно запобігаючи подальшому зниженню.
- Рівні опору: Області, де очікується, що тиск продавців переважить тиск покупців, потенційно обмежуючи подальше зростання цін.
Розпізнавання цих ключових рівнів дозволяє трейдерам передбачити можливі цінові рухи та розробити ефективніші торгові стратегії.
Часові рамки, ліквідність та фундаментальний аналіз
Часові рамки
Різні часові рамки графіків розкривають різні ринкові патерни:
- Довші часові рамки (щоденні, тижневі, місячні) підкреслюють ширші тренди та загальний напрямок ринку.
- Коротші часові рамки (годинні, 15-хвилинні, 5-хвилинні) зосереджуються на короткострокових змінах цін та волатильності, корисні для денних трейд�ерів.
Ліквідність та обсяг торгів
Ліквідність та обсяг торгів впливають на стабільність цін та виконання угод:
- Високий обсяг торгів підтверджує сильні тренди та зменшує маніпуляції цінами.
- Низька ліквідність може збільшити волатильність, викликаючи більші коливання цін та потенційне прослизання.
Дізнайтеся більше про ліквідність та її вплив на ліквідність Біткоїна.
Фундаментальний аналіз
Фундаментальний аналіз оцінює довгострокову цінність та ринковий потенціал Біткоїна, враховуючи:
- Рівні прийняття (інституційний та роздрібний інтерес)
- Технологічні розробки (оновлення мережі та інновації)
- Регуляторні зміни, що впливають на крипторинок
Поєднання технічного та фундаментального аналізу надає ширшу перспективу ринку, допомагаючи трейдерам ухвалювати обґрунтовані рішення.
Дізнайтеся більше про фундаментальний аналіз.
Управління ризиками та психологія торгівлі
Успішне управління ризиками торгівлі Біткоїном вимагає стратегічного планування та емоційної дисципліни. Основні техніки управління ризиками включають:
- Стоп-лос ордери: Встановлюйте заздалегідь визначені точки виходу, щоб обмежити потенційні втрати та захистити ваш капітал.
- Розмір позиції: Виділяйте лише контрольовану частину вашого портфеля на кожну угоду, щоб керувати експозицією.
- Емоційна дисципліна: Уникайте імпульсивних рішень, викликаних страхом або жадібністю, та дотримуйтесь своєї торгової стратегії.
Дізнайтеся більше про волатильність Біткоїна та розгляньте можливість використання усереднення доларових витрат як стратегії зниження ризику.
Графіки Біткоїна та ширша екосистема
Графіки Біткоїна надають уявлення про цінові тренди, але ширша криптоекосистема також може впливати на рухи цін Біткоїна. Такі фактори, як альткоїни, DeFi та NFT, впливають на ринкові настрої та ліквідність.
- Альткоїни та відносини з Біткоїном: Дізнайтеся про альткоїни та порівняйте їх вплив на Біткоїн у Біткоїн проти альткоїнів.
- DeFi та NFT: Досліджуйте, як DeFi та NFT формують крипторинок та впливають на попит на Біткоїн.
- Біткоїн-біржі: Зрозумійте, як торгові платформи впливають на ліквідність, з як працюють біржі Біткоїна, та відмінності між централізованими біржами (CEXs) та децентралізованими біржами (DEXs).
- Захист вашого Біткоїна: Захистіть ваші активи, дізнавшись про Біткоїн-гаманці, як створити Біткоїн-гаманець, та вибір між кастодіальними та некастодіальними гаманцями. Забезпечте надійні практики безпеки та захистіть свої приватні ключі.
Розуміння відносин Біткоїна з ширшою криптоекосистемою може допомогти трейдерам та інвесторам приймати обґрунтовані рішення.
Висновок: Практика та безперервне навчання
Опановування аналізу графіків Біткоїна вимагає практики та безперервного навчання. Почніть з основ, експериментуйте з різними типами графіків та індикаторами, та удосконалюйте свою торгову стратегію з часом. Бути в курсі ринкових трендів, новин та ширших крипторозробок є важливим для ухвалення обґрунтованих торгових рішень.
Досліджуйте потенційне майбутнє Біткоїна з прогнозом цін Біткоїна та продовжуйте розширювати свої знання, щоб успішно орієнтуватися в еволюціонуючому крипторинку.
Пов'язані посібники
Почніть звідси →
Що таке Біткоїн?
Отримайте просте введення в Біткоїн та дізнайтеся, чому це важливо.
Що таке Біткоїн?
Отримайте просте введення в Біткоїн та дізнайтеся, чому це важливо.

Як купити біткоїн?
Дізнайтеся, як отримати свій перший біткоїн за лічені хвилини.
Як купити біткоїн?
Дізнайтеся, як отримати свій перший біткоїн за лічені хвилини.

Як продати біткоїн?
Дізнайтеся, як безпечно продати біткоїн за місцеву валюту.
Як продати біткоїн?
Дізнайтеся, як безпечно продати біткоїн за місцеву валюту.
Торгівля Біткоїном для Початківців
Всеосяжний посібник з торгівлі Bitcoin для початківців, що охоплює гаманці, біржі, аналіз ринку та стратегії управління ризиками.
Торгівля Біткоїном для Початківців
Всеосяжний посібник з торгівлі Bitcoin для початківців, що охоплює гаманці, біржі, аналіз ринку та стратегії управління ризиками.

Що таке Bitcoin-гаманець?
Дізнайтеся про цей важливий інструмент для надсилання, отримання та зберігання вашого біткоїна; як він працює та як безпечно ним користуватися.
Що таке Bitcoin-гаманець?
Дізнайтеся про цей важливий інструмент для надсилання, отримання та зберігання вашого біткоїна; як він працює та як безпечно ним користуватися.
Як працює обмін біткоїнів?
Наскільки безпечно зберігати вашу криптовалюту на централізованих біржах?
Як працює обмін біткоїнів?
Наскільки безпечно зберігати вашу криптовалюту на централізованих біржах?

БУДЬТЕ ПОПЕРЕДУ В КРИПТОВАЛЮТІ
Будьте попереду в криптовалюті з нашою щотижневою розсилкою, що надає найважливіші інсайти

Щотижневі новини про криптовалюти, підібрані для вас

Практичні інсайти та освітні поради

Оновлення про продукти, що сприяють економічній свободі
Ніякого спаму. Відписатися в будь-який час.
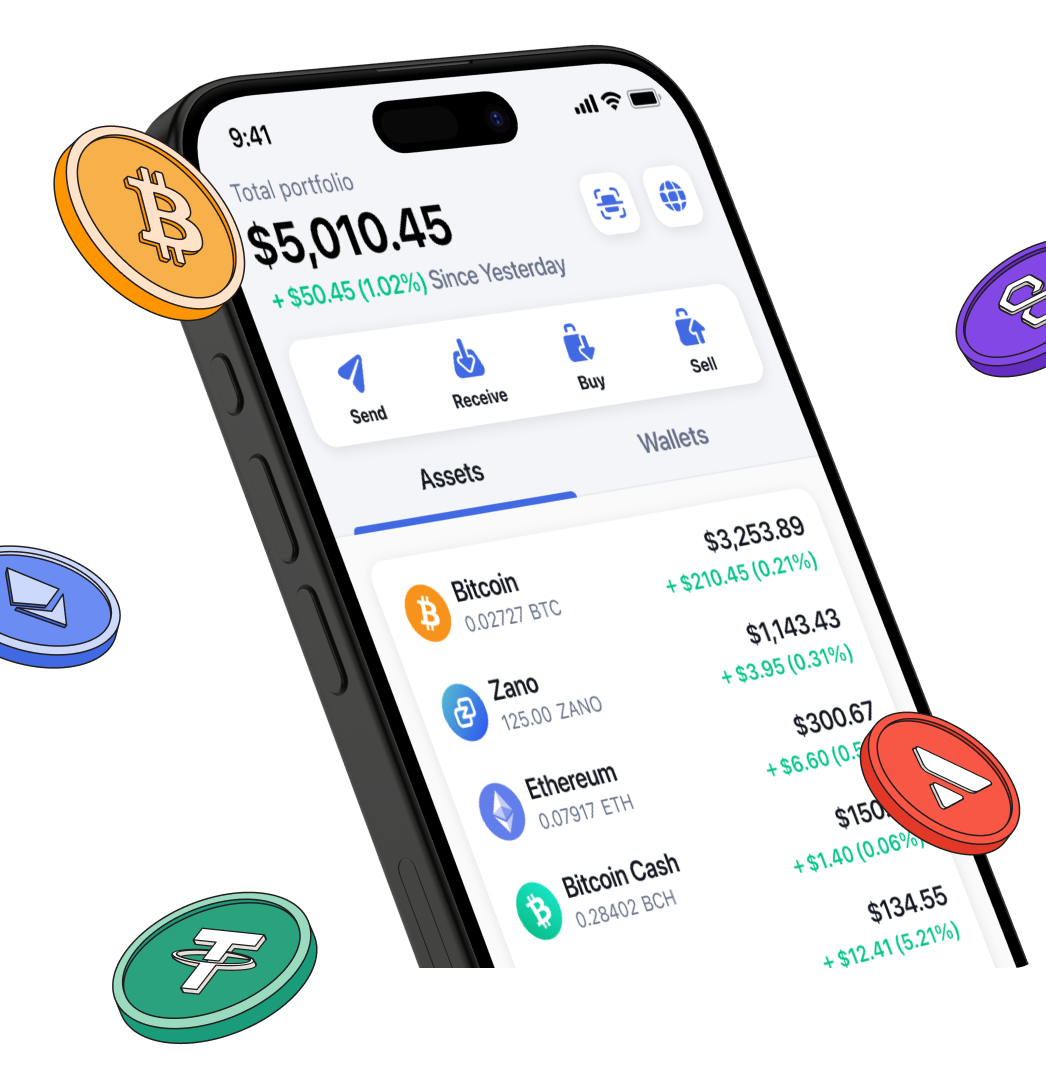
Почніть інвестувати безпечно з Bitcoin.com Wallet
Більше гаманців створено досі
Все, що вам потрібно для безпечної купівлі, продажу, торгівлі та інвестування вашого Bitcoin та криптовалюти
Завантажити додаток


© 2026 Saint Bitts LLC Bitcoin.com. Всі права захищено.
Завантажити додаток
Компанія
Інсайти
Продукти та Сервіси
Рецензії
Слідкувати
© 2026 Saint Bitts LLC Bitcoin.com. Всі права захищено.