ตัวบ่งชี้ MACD คืออะไร? คู่มือเกี่ยวกับการเคลื่อนที่เฉลี่ยและความแตกต่างในคริปโต
อัปเดตล่าสุด
เขียนโดย

ตรวจสอบโดย

สารบัญ
ข้อจำกัดความรับผิดชอบ: บทความนี้มีวัตถุประสงค์เพื่อการศึกษาเท่านั้นและไม่ได้เป็นคำแนะนำทางการเงิน ควรทำการวิจัยของคุณเองเสมอก่อนตัดสินใจลงทุน
ภาพรวมของ MACD
Moving Average Convergence Divergence (MACD) ถูกพัฒนาโดย Gerald Appel ในช่วงปลายทศวรรษ 1970 มันคือ ตัวบ่งชี้โมเมนตัมตามแนวโน้ม ที่เปรียบเทียบการเคลื่อนไหวของราคาระยะสั้นและระยะยาวโดยใช้ค่าเฉลี่ยเคลื่อนที่แบบเอ็กซ์โพเนนเชียล (EMA)
โดยการติดตามความสัมพันธ์ระหว่างค่าเฉลี่ยเคลื่อนที่เหล่านี้ MACD จะแสดงเมื่อโมเมนตัมกำลังแข็งแกร่งขึ้น อ่อนแอลง หรือกลับทิศทาง
แตกต่างจากตัวบ่งชี้�นำที่พยายามทำนายการเคลื่อนไหวในอนาคต MACD เป็น ตัวบ่งชี้ที่ล่าช้า - มันตอบสนองต่อการเปลี่ยนแปลงของราคาที่เกิดขึ้นแล้ว สิ่งนี้ทำให้มันมีประโยชน์อย่างยิ่งในการยืนยันแนวโน้มหรือระบุความแตกต่างระหว่างราคาและโมเมนตัม
ลักษณะของ MACD
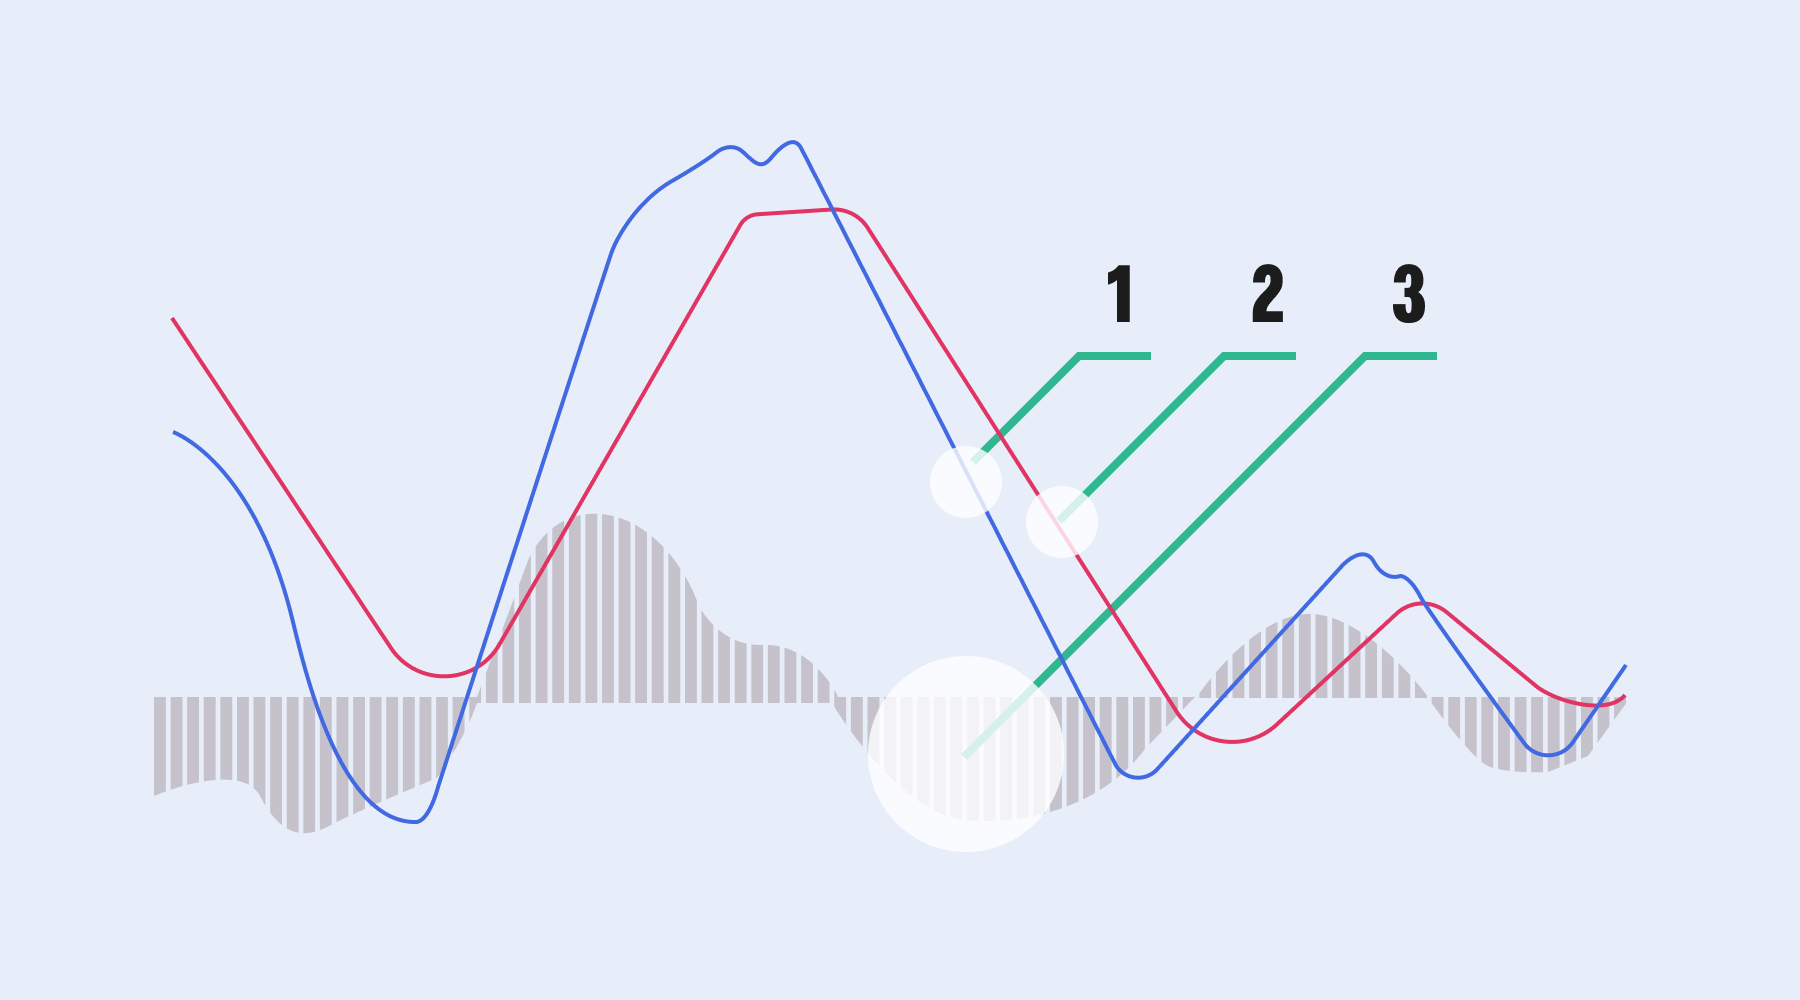
MACD ประกอบด้วยสามองค์ประกอบหลักที่พล็อตบนกราฟใต้ราคาสินทรัพย์:
- เส้น MACD - ความแตกต่างระหว่าง EMA ระยะสั้น (ทั่วไป 12 รอบ) และ EMA ระยะยาว (ทั่วไป 26 รอบ)
- เส้นสัญญาณ - EMA ระยะ 9 รอบของเส้น MACD ใช้ในการสร้างสัญญาณซื้อหรือขาย
- ฮิสโตแกรม - แผนภูมิแท่งที่แสดงระยะห่างระหว่างเส้น MACD และเส้นสัญญาณ
ทั้งสามส่วนจะผันผวนอยู่เหนือและต่ำกว่าเส้นศูนย์ ซึ่งทำหน้าที่เป็นจุดกึ่งกลางระหว่างโมเมนตัมขาขึ้นและขาลง
เกณฑ์สัญญาณและสูตร
MACD คำนวณในสามขั้นตอน:
ขั้นตอนที่ 1 - เส้น MACD
เส้น MACD = EMA(12) - EMA(26)
ขั้นตอนที่ 2 - เส้นสัญญาณ
เส้นสัญญาณ = EMA(9) ของเส้น MACD
ขั้นตอนที่ 3 - ฮิสโตแกรม
ฮิสโตแกรม = เส้น MACD - เส้นสัญญาณ
แพลตฟอร์มการสร้างกราฟส่วนใหญ่ใช้การตั้งค่า MACD (12, 26, 9) มาตรฐานโดยค่าเริ่มต้น อย่างไรก็ตาม นักเทรดสามารถปรับระยะเหล่านี้เพื่อทำให้ตัวบ่งชี้มีความอ่อนไหวต่อการเปลี่ยนแปลงของราคามากขึ้นหร��ือน้อยลง
วิธีการตีความ MACD
-
การตัดผ่านเส้นสัญญาณ
- การตัดผ่านขาขึ้น - เส้น MACD เคลื่อนที่เหนือเส้นสัญญาณ แสดงถึงโมเมนตัมขาขึ้นและเป็นสัญญาณซื้อที่อาจเกิดขึ้น
- การตัดผ่านขาลง - เส้น MACD เคลื่อนที่ต่ำกว่าเส้นสัญญาณ แสดงถึงโมเมนตัมขาลงและเป็นสัญญาณขายที่อาจเกิดขึ้น
-
การตัดผ่านเส้นศูนย์
- เหนือศูนย์ - EMA ระยะสั้นสูงกว่า EMA ระยะยาว แสดงถึงโมเมนตัมขาขึ้น
- ต่ำกว่าศูนย์ - EMA ระยะสั้นต่ำกว่า EMA ระยะยาว แสดงถึงโมเมนตัมขาลง
-
ความแตกต่าง
- ความแตกต่างขาขึ้น - ราคาทำจุดต่ำสุดที่ต่ำกว่าในขณะที่ MACD ทำจุดต่ำสุดที่สูงขึ้น สิ่งนี้สามารถบ่งชี้ว่าการกดดันขายกำลังอ่อนแอลงและอาจเกิดการกลับทิศทาง
- ความแตกต่างขาลง - ราคาทำจุดสูงสุดที่สูงขึ้นในขณะที่ MACD ทำจุดสูงสุดที่ต่ำลง สิ่งนี้สามารถบ่งชี้ว่าการกดดันซื้อกำลังอ่อนแอลงและอาจเกิดการกลับทิศทางลง
ตัวอย่างในการปฏิบัติ
ลองจินตนาการว่า Bitcoin กำลังซื้อขายในแนวโน้มขาขึ้นอย่างมั่นคง เส้น MACD �ตัดผ่านเส้นสัญญาณและทั้งสองอยู่เหนือเส้นศูนย์ ในเวลาเดียวกัน ฮิสโตแกรมกลายเป็นบวก แสดงถึงโมเมนตัมที่กำลังเติบโต
นักเทรดอาจเห็นสิ่งนี้เป็นการยืนยันที่จะอยู่ในตำแหน่ง long หรือเข้าสู่ตำแหน่งใหม่ ในทางกลับกัน หากเส้น MACD ลดลงต่ำกว่าเส้นสัญญาณในขณะที่ยังอยู่เหนือศูนย์ อาจบ่งชี้ถึงโมเมนตัมที่อ่อนแอลง ซึ่งเป็นสัญญาณให้กระชับจุดหยุดหรือนำกำไรออก
ข้อจำกัดของ MACD
แม้ว่า MACD จะทรงพลัง แต่ก็ไม่สามารถเชื่อถือได้ทั้งหมด:
- มันสามารถสร้าง สัญญาณเท็จ ในตลาดที่เคลื่อนไหวด้านข้างหรือไม่แน่นอน
- ความแตกต่างไม่ได้หมายถึงการกลับทิศทางเสมอไป
- การพึ่งพา MACD เพียงอย่างเดียวเพิ่มความเสี่ยงในการเข้าสู่หรือออกจากตลาดผิดเวลา
ด้วยเหตุนี้ นักเทรดหลายคนจึงรวม MACD กับเครื่องมืออื่นๆ เช่น Relative Strength Index (RSI) เส้นแนวโน้ม หรือระดับแนวรับ/แนวต้าน
บทสรุป
MACD เป็นตัวบ่งชี้ที่หลากหลายที่ช่วยให้นักเทรด ติดตามทิศทางแนวโน้ม และ การเปลี่ยนแปลงโมเมนตัม โดยการเรียนรู้ที่จะอ่านการตัดผ่าน การเคลื่อนไหวของเส้นศูนย์ และความแตกต่าง นักเทรดสามารถจังหวะการเข้าและออกได้ดียิ่งขึ้น
มันถูกใช้ดีที่สุดเป็นส่วนหนึ่งของกลยุทธ์การซื้อขายที่กว้างขึ้นซึ่งรวมถึงสัญญาณยืนยันและการจัดการความเสี่ยง
ขั้นตอนถัดไป
- เรียนรู้เกี่ยวกับ Relative Strength Index (RSI) ตัวบ่งชี้โมเมนตัมอีกตัวที่จับคู่ได้ดีกับ MACD
- สำรวจรูปแบบการกลับตัวของแท่งเทียน เช่น Morning Star หรือ Bullish Engulfing เพื่อนำมารวมกับการตัดผ่าน MACD
- ฝึกระบุสัญญาณ MACD บนกราฟคริปโตสดด้วยเครื่องมือสร้างกราฟฟรีเพื่อเพิ่มความแม่นยำในการจับเวลา
โดยการนำตัวบ่งชี้ MACD มารวมเข้ากับกลยุทธ์การซื้อขายที่กว้างขึ้นซึ่งรวมถึงสัญญาณยืนยันและการจัดการความเสี่ยง นักเทรดสามารถปรับปรุงความสามารถในการจับเวลาในการเข้าและออกและตัดสินใจได้อย่างมั่นใจยิ่งขึ้น
สำรวจบทความที่เ�กี่ยวข้อง:
- คู่มือสำหรับผู้เริ่มต้นเกี่ยวกับกราฟแท่งเทียน
- รูปแบบค้อนขาขึ้นที่กำลังขึ้นอธิบาย
- รูปแบบดาวยิง (ค้อนขาลง) อธิบาย
- Bullish Engulfing: สัญญาณว่าผู้ซื้อกำลังเข้าครอบครอง
- Bearish Engulfing: สัญญาณว่าผู้ขายกำลังเข้าควบคุม
- รูปแบบ Morning Star: สัญญาณว่าผู้ซื้อกำลังก้าวเข้ามา
- Evening Star: สัญญาณว่าผู้ขายกำลังก้าวเข้ามา
- Golden Cross: สัญญาณว่าโมเมนตัมขาขึ้นกำลังสร้าง
- Bearish (Death) Cross: สัญญาณว่าโมเมนตัมอาจเปลี่ยนทิศทางต่อตลาด
- Pi Cycle Top: สัญญาณว่า Bitcoin อาจถึงจุดสูงสุด
- Relative Strength Index (RSI): การระบุตลาดที่ซื้อมากเกินไปและขายมากเกินไป
- Stochastic Oscillator: การวัดโมเมนตัมและระบุการกลับทิศทาง
เริ่�มต้นด้วยการทำความเข้าใจพื้นฐานของ cryptocurrency และสำรวจ การเงินแบบกระจายศูนย์ (DeFi). เรียนรู้เกี่ยวกับ Bitcoin, Ethereum, และ altcoins. นอกจากนี้ ค้นพบวิธี ซื้อ และ ขาย คริปโต.
ข้อจำกัดความรับผิดชอบ
ไม่มีคำแนะนำในการลงทุน
ข้อมูลที่ให้ไว้ในบทความนี้มีวัตถุประสงค์เพื่อการศึกษาเท่านั้นและไม่ถือเป็นคำแนะนำในการลงทุน คำแนะนำทางการเงิน คำแนะนำในการซื้อขาย หรือคำแนะนำประเภทอื่นๆ Bitcoin.com ไม่แนะนำหรือสนับ��สนุนการซื้อ ขาย หรือถือครองสกุลเงินดิจิทัล โทเค็น หรือเครื่องมือทางการเงินใดๆ คุณไม่ควรพึ่งพาเนื้อหาของบทความนี้เป็นพื้นฐานในการตัดสินใจลงทุนใดๆ ควรทำการวิจัยของคุณเองและปรึกษาผู้แนะนำทางการเงินที่ได้รับใบอนุญาตก่อนตัดสินใจลงทุนใดๆ
ความถูกต้องของข้อมูล
แม้ว่าเราจะพยายามรับรองความถูกต้องและความน่าเชื่อถือของข้อมูลที่นำเสนอ แต่ Bitcoin.com ไม่รับประกันเกี่ยวกับความสมบูรณ์ ทันเวลา หรือความถูกต้องของเนื้อหาใดๆ ข้อมูลทั้งหมดให้แบบ "ตามที่เป็น" และอาจมีการเปลี่ยนแปลงโดยไม่ต้องแจ้งให้ทราบ คุณเข้าใจว่าการใช้ข้อมูลใดๆ ที่มีอยู่ที่นี่เป็นความเสี่ยงของคุณเอง
คู่มือที่เกี่ยวข้อง
เริ่มจากที่นี่ →
DEX คืออะไร?
การแลกเปลี่ยนแบบกระจายอำนาจ (DEX) เป็นประเภทของการแลกเปลี่ยนที่เชี่ยวชาญในการทำธุรกรรมแบบเพียร์ทูเพียร์ของสกุลเงินดิจิทัลและสินทรัพย์ดิจิทัล ไม่เหมือนกับการแลกเปลี่ยนแบบรวมศูนย์ (CEXs) DEXs ไม่ต้องการบุคคลที่สามที่เชื่อถือได้หรือคนกลางในการอำนวยความสะดวกในการแลกเปลี่ยนคริปโตแอสเซ็ต
DEX ค��ืออะไร?
การแลกเปลี่ยนแบบกระจายอำนาจ (DEX) เป็นประเภทของการแลกเปลี่ยนที่เชี่ยวชาญในการทำธุรกรรมแบบเพียร์ทูเพียร์ของสกุลเงินดิจิทัลและสินทรัพย์ดิจิทัล ไม่เหมือนกับการแลกเปลี่ยนแบบรวมศูนย์ (CEXs) DEXs ไม่ต้องการบุคคลที่สามที่เชื่อถือได้หรือคนกลางในการอำนวยความสะดวกในการแลกเปลี่ยนคริปโตแอสเซ็ต

CEX คืออะไร?
เรียนรู้เกี่ยวกับ CEXs ความแตกต่างระหว่างพวกเขากับ DEXs และความปลอดภัยในการใช้งาน
CEX คืออะไร?
เรียนรู้เกี่ยวกับ CEXs ความแตกต่างระหว่างพวกเขากับ DEXs และความปลอดภัยในการใช้งาน

การแลกเปลี่ยนสกุลเงินดิจิทัลทำงานอย่างไร?
การเก็บคริปโตไว้ในศูนย์กลางการแลกเปลี่ยนปลอดภัยแค่ไหน?
การแลกเปลี่ยนสกุลเงินดิจิทัลทำงานอย่างไร?
การเก็บคริปโตไว้ในศูนย์กลางการแลกเปลี่ยนปลอดภัยแค่ไหน?
การซื้อขาย Bitcoin สำหรับผู้เริ่มต้น
คู่มือที่ครอบคลุมสำหรับการซื้อขายบิตคอยน์สำหรับผู้เริ่มต้น ครอบคลุมกระเป๋าเงิน การแลกเปลี่ยน การวิเคราะห์ตลาด และกลยุทธ์การจัดการความเสี่ยง
การซื้อขาย Bitcoin สำหรับผู้เริ่มต้น
คู่มือที่ครอบคลุมสำหรับการซื้อขายบิตคอยน์สำหรับผู้เริ่มต้น ครอบคลุมกระเป๋าเงิน การแลกเปลี่ยน การวิเคราะห์ตลาด และกลยุทธ์การจัดการความเสี่ยง

การอ่านกราฟ Bitcoin สำหรับผู้เริ่มต้น
คู่มือสำหรับมือใหม่ในการทำความเข้าใจกราฟ Bitcoin ครอบคลุมรูปแบบแท่งเทียน ตัวชี้วัดทางเทคนิค การวิเคราะห์ตลาด และการจัดการความเสี่ยง
การอ่านกราฟ Bitcoin สำหรับผู้เริ่มต้น
คู่มือสำหรับมือใหม่ในการทำความเข้าใจกราฟ Bitcoin ครอบคลุมรูปแบบแท่งเทียน ตัวชี้วัดทางเทคนิค การวิเคราะห์ตลาด และการจัดการความเสี่ยง

ตลาดกระทิง vs. ตลาดหมี
เรียนรู้เกี่ยวกับตลาดกระทิงและตลาดหมี ลักษณะเฉพาะของแต่ละตลาด และกลยุทธ์ที่มีประสิทธิภาพสำหรับแต่ละตลาด ทำความเข้าใจบทบาทของบิตคอยน์ในตลาดเหล่านี้และวิธีการจัดการกับความผันผวนของตลาด
ตลาดกระทิง vs. ตลาดหมี
เรียนรู้เกี่ยวกับตลาดกระทิงและตลาดหมี ลักษณะเฉพาะของแต่ละตลาด และกลยุทธ์ที่มีประสิทธิภาพสำหรับแต่ละตลาด ทำความเข้าใจบทบาทของบิตคอยน์ในตลาดเหล่านี้และวิธีการจัดการกับความผันผวนของตลาด
การวิเคราะห์การซื้อขาย: พื้นฐาน เทคนิค และอารมณ์
เรียนรู้เกี่ยวกับการวิเคราะห์ปัจจัยพื้นฐาน เทคนิค และอารมณ์ในการตัดสินใจซื้อขายที่ชาญฉลาดขึ้น สำรวจตัวอย่าง เครื่องมือ และวิธีการผสมผสานวิธีการเหล่านี้เพื่อมุมมองตลาดที่ครอบคลุม
การวิเคราะห์การซื้อขาย: พื้นฐาน เทคนิค และอารมณ์
เรียนรู้เกี่ยวกับการวิเคราะห์ปัจจัยพื้นฐาน เทคนิค และอารมณ์ในการตัดสินใจซื้อขายที่ชาญฉลาดขึ้น สำรวจตัวอย่าง เครื่องมือ และวิธีการผสมผสานวิธีการเหล่านี้เพื่อมุมมองตลาดที่ครอบคลุม

ก้าวนำหน้าในคริปโต
ล้ำหน้ากับคริปโตด้วยจดหมายข่าวรายสัปดาห์ของเราที่นำเสนอข้อมูลเชิงลึกที่สำคัญที่สุด

ข่าวคริปโตประจำสัปดาห์ที่คัดสรรมาเพื่อคุณ

ข้อมูลเชิงลึกที่นำไปใช้ได้และเคล็ดลับการศึกษา

อัปเดตผลิตภัณฑ์ที่ส่งเสริมเสรีภาพทางเศรษฐกิจ
ไม่มีสแปม ยกเลิกการสมัครได้ทุกเมื่อ

เริ่มต้นลงทุนอย่างปลอดภัยด้วยกระเป๋าเงิน Bitcoin.com
กระเป๋าเงินมากกว่า ใบถูกสร้างขึ้นแล้วจนถึงขณะนี้
ทุกสิ่งที่คุณต้องการเพื่อซื้อ ขาย แลกเปลี่ยน และลงทุนใน Bitcoin และสกุลเงินดิจิทัลของคุณอย่างปลอดภัย
ดาวน์โหลดแอป


© 2026 Saint Bitts LLC Bitcoin.com. สงวนลิขสิทธิ์ทั้งหมด
ดาวน์โหลดแอป
บริษัท
ข้อมูลเชิงลึก
ผลิตภัณฑ์และบริการ
รีวิว
ติดตาม
© 2026 Saint Bitts LLC Bitcoin.com. สงวนลิขสิทธิ์ทั้งหมด